 By Elifsu Gencer Most of us remember the colors of the rainbow with the acronym “ROYGBIV,” and we all have one of the most famous physicists to thank for this mnemonic. That’s right, Sir Isaac Newton—best known for his theory of gravity, three Laws of Motion, and invention of calculus—played a crucial role in developing what we know today as the color wheel. In the 1660s, Newton studied the dispersion of white sunlight into various colors by allowing a single beam of light to pass through a glass prism. From the first of these experiments, he remarked, “It was at first a very pleasing divertissement, to view the vivid and intense colors produced thereby... I became surprised to see them in an oblong form, which, according to the received laws of refractions, I expected should have been circular.” In other words, although Newton had expected the color spectrum to be circular because of the shape of the hole from which the light was emitted, the pattern that he observed was surprisingly elongated. After more experimentation, Newton ultimately determined that these observations could be attributed to the fact that light is composed of refrangible rays that bend at different angles when passing through the prism. These rays do not converge to the same point, even though this would’ve been observed with a circular spectrum. In his spectrum, Newton initially identified five colors — red, yellow, green, blue, and violet — but subsequently named two additional colors, orange and indigo, to yield a total of seven spectral constituents of white light. Newton’s division of the spectrum into seven colors is especially interesting due to his association of the constituents with the seven notes of a musical scale. In fact, Newton hypothesized that color stimuli were conveyed to the brain by vibrations in the optic nerve, claiming that division of the spectrum into seven colors “may perhaps suggest analogies between harmonies of sounds and harmonies of colors.” He presented his findings in the form of a circular color wheel in his 1704 book titled Opticks, with letters around the wheel denoting musical notes of the Dorian mode, one of the eight traditional modal scales. The scale starts on D, and orange and indigo are located where half steps in the musical scale occur. 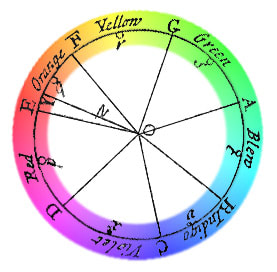 Newton’s color wheel was remarkable in several ways. The circle suggested the additive nature of colored lights, which occurs when lights of different wavelengths are mixed. According to Newton, the specific wavelength of a color is determined by the averaged relative strengths of its constituent lights. His color wheel was also the first graphical representation of saturation, as he organized the colors in increasing intensity proportional to the distance from the center of the circle. Additionally, Newton referred to red, blue, and green as the “primary colors” of light after noting that a combination of all three colors regenerated white light. These regions could then be combined in different proportions to make all the other colors of the spectrum. In the present day, the three primary colors might be more familiar to some of us as the acronym RBG, often listed as such on computer displays. Also, the colors on the wheel were arranged in order of their corresponding wavelengths such that the primary colors were located opposite to their complementary colors, constituting pairs that created white light when mixed together, such as blue and yellow light when combined at full intensity. Many earlier models presented color as a linear scale, unlike Newton’s circular model. Aristotle, for example, arranged color on a scale ranging between white and black, which he perceived to be the two primary colors that produced all other colors. Moreover, although color circles had existed before Newton’s studies, as evident with the urine wheel diagram—which dates back to the medieval era and was intended to display medical implications of the different colors of urine—Newton is credited as the first to develop a formal circular diagram of colors in 1666. His findings not only changed our understanding of the nature of light, but also formed the core of modern color theory used by artists today. 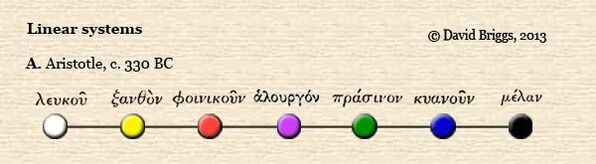 Aristotle’s linear scale of color ranging from white to black. Darker colors such as blue were located closer to black, and lighter colors such as yellow were closer to white.
1 Comment
Marie Meyer
7/21/2024 03:22:19 pm
Can you tell me where Newton refers to red, blue, and green as the “primary colors” of light? Leave a Reply. |